

Agroforestry is defined as the integration of trees and agricultural crops or animals in a single unit of land for the effective and efficient utilization of natural resources. Agroforestry systems have been considered as a sustainable and resilient alternative agriculture practice to ameliorate soil conditions and enhance crop productivity. Soil temperature and moisture influence many soil physical, chemical and biological processes that occur in soil. These processes include infiltration, hydraulic conductivity, greenhouse gas production, soil microbial activity, seed germination, and plant growth. Agroforestry systems can influence soil temperature and moisture by altering microclimate conditions such as light, temperature, wind speed and relative humidity. Plant size, architecture, row width, and orientation can cause spatial and temporal variations in soil temperature and moisture in agroforestry systems due to shading effects (Horton et al., 1984; Horton, 1989; Ham and Kluitenberg, 1993; Colaizzi et al., 2010; Pieri, 2010; Mittelbach and Seneviratne, 2012). Furthermore, soil temperature and moisture fluctuations in an agroforestry system can be complicated due to the various components in a single system such as deep tree roots, shallow roots of crop species, and complementarity and facilitation effects among the crops (Niether et al., 2017). Knowledge of the near surface spatial and temporal variations in soil temperature and moisture in agroforestry system can potentially enhance our understanding of soil’s physical, chemical, and biological processes in these systems.
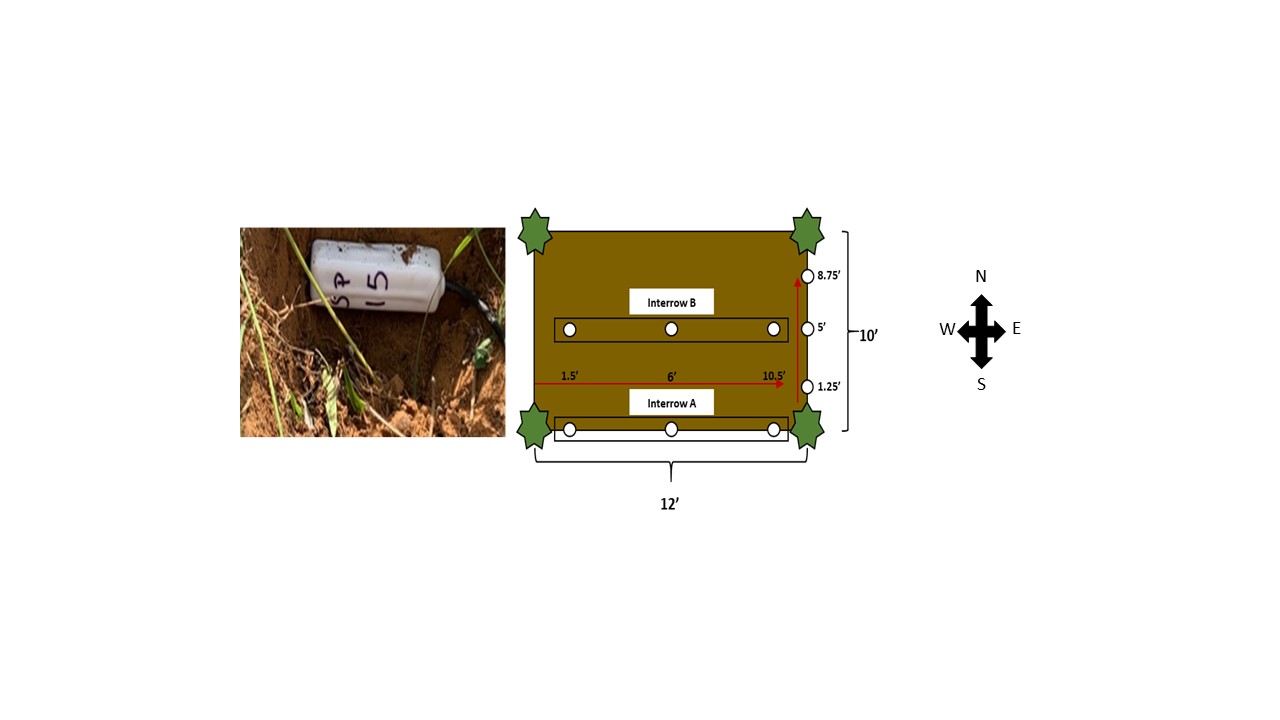 Figure 1. The left image shows the soil sensor installed at depth of 5 cm below the soil surface. The right image shows the locations of the soil sensors in the double rows of loblolly pine trees.
In this article, we present near surface soil temperature and water content dynamics for an alley crop based agroforestry system at the Winfred Thomas Agricultural Research Station in Hazel Green, AL in 2019. The total length of the agroforestry system is 400’. Loblolly pines were planted in a double-row tree set configuration (10’x12’x40’; Fig. 1) in a north to south orientation. The trees were spaced 10’ apart within a row and 12’ apart between the double rows, and the alley space between the two double rows of trees was 40’. A total of 160 loblolly pines were planted in the agroforestry system. Six specialty vegetable crops were grown on raised beds in the alley space. Soil temperature and water content was measured using GS3 soil moisture sensors (METER Group Inc., Pullman, WA, USA). Sensors were installed 5 cm below the soil surface at various locations in the tree interrow and tree row (Fig. 1). Soil temperature and water content were measured every 30 minutes. Climatic conditions were measured using an ATMOS 41 weather station (METER Group Inc., Pullman, WA, USA).
Daily mean soil temperatures at each location for interrow A and B and the tree row displayed patterns similar to the daily mean air temperature (Fig. 2). Daily mean soil temperatures at all locations for interrow B were higher than daily mean soil temperatures at corresponding locations for interrow A. Overall, mean soil temperature among all locations in interrow B was 0.65oC higher than the mean soil temperature among all locations for interrow A. The smallest difference in soil temperature at corresponding locations for interrow A and B was observed at the 6 ft interrow location. The mean soil temperature among all locations in the tree row were lower than the soil temperatures for the interrow locations in A and B.
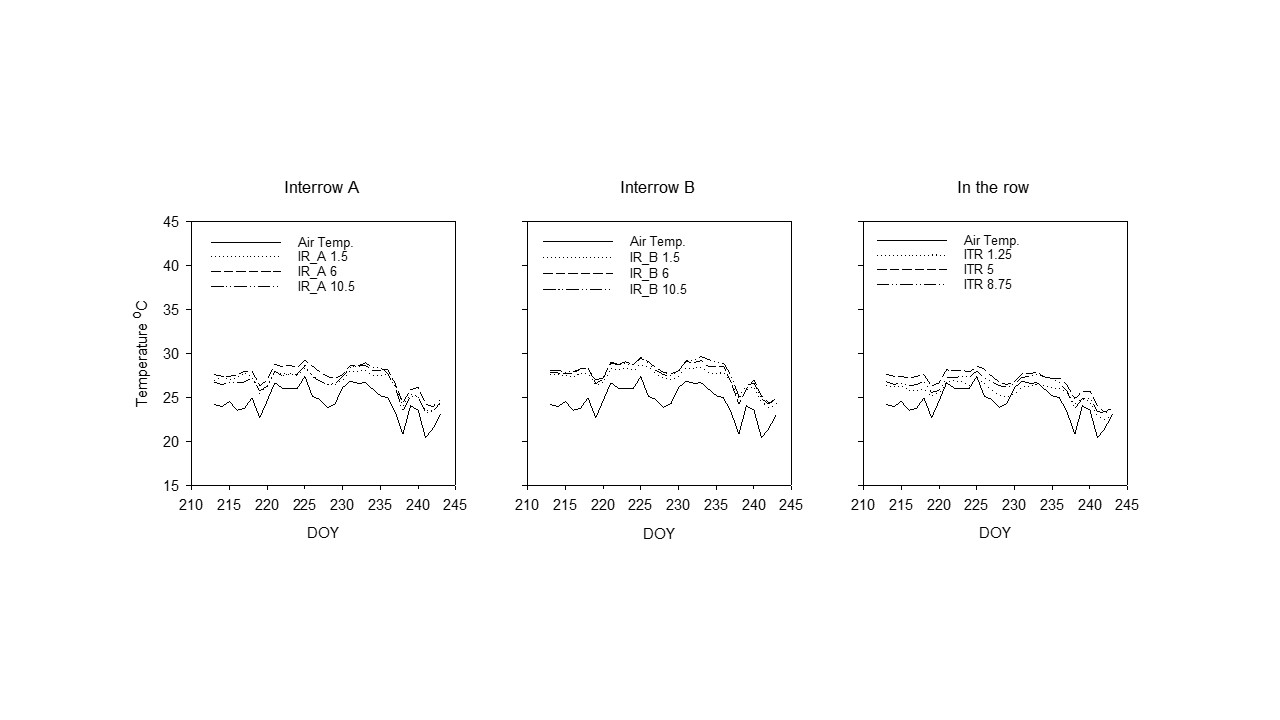 Figure 2. Daily mean soil temperatures at locations (1.5, 6, and 10.5 ft.) for interrow A and B and locations (1.25, 5, and 8.75 ft.) in the tree row.
Figure 3 shows the daily mean soil water contents at each location for interrows A and B and in the tree row. Soil water content at each location displayed responses to precipitation. A period of drying from DOY 220 to 237 was clearly distinguishable (Fig.3). The largest differences in soil water content between corresponding locations for interrows A and B were observed at the 1.5’ and 10.5’ locations. The mean soil water content among all locations for interrow A was approximately 2% higher than the mean soil water among all locations for interrow B. Soil water contents for the locations in the tree row decreased by approximately 4.6% with distance from the 1.25’ location. Mean soil water content among the locations in the tree row was 1% less than the mean soil water among all locations for interrow A. No difference in mean soil water content among all locations in the tree row and interrow B was observed.
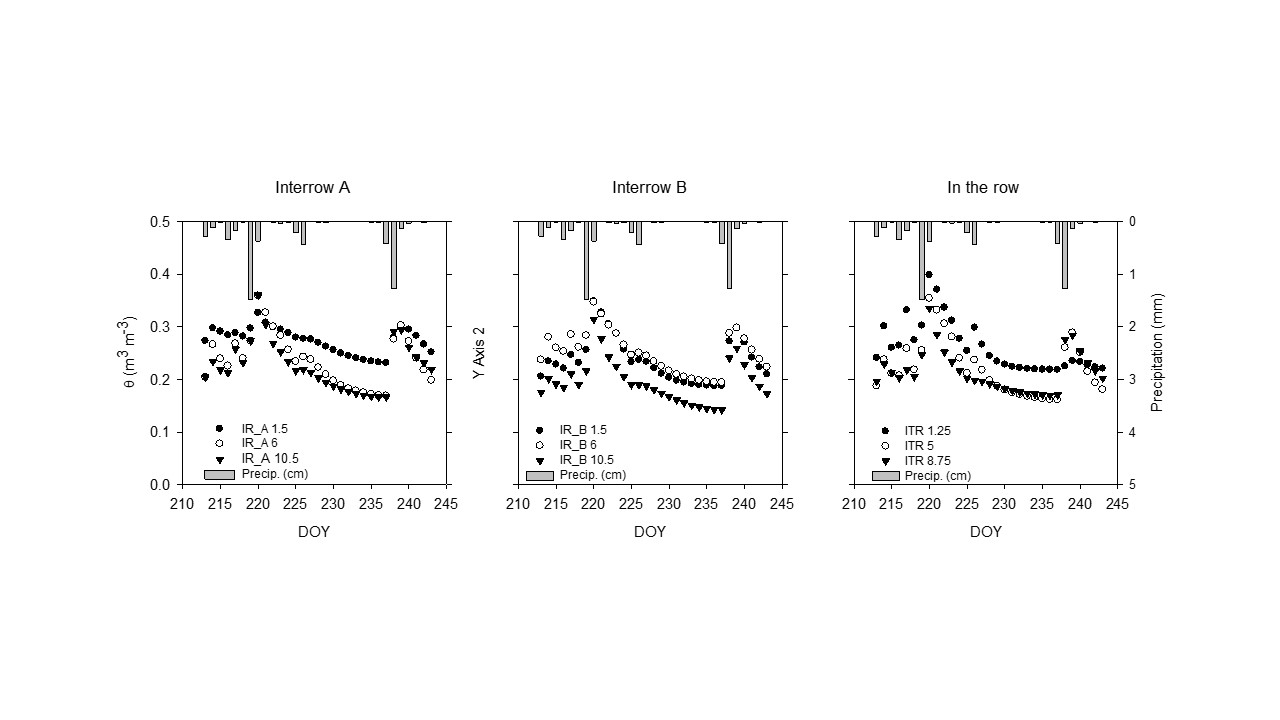 Figure 3. Daily mean soil water content at locations (1.5, 6, and 10.5 ft.) for interrow A and B and locations (1.25, 5, and 8.75 ft.) in the tree row.
The differences in soil temperature and water content among the two interrow and the tree row areas can potentially be attributed to the effects of the trees. For interrow area A, shading effects from the tree can influence soil water content and soil temperature conditions. Furthermore, rainfall interception by the trees and subsequent throughfall can potentially influence soil water content dynamics. There were no shading effects for interrow area B. Soil temperature and water content in the tree row was possibly only affected by the trees at the 1.25’ location. These measurements demonstrate how soil temperature and water content can vary in an agroforestry system. Based on these results, soil temperature and moisture conditions in the raised beds will potentially be influenced with continued growth of the loblolly pine trees. Additional measurements of tree shade patterns can enhance our understanding of soil temperature and water content dynamics.
References
Colaizzi, P. D., S. A. O’Shaughnessy, P. H. Gowda, S. R. Evett, T. A. Howell, W. P. Kustas, and M. C. Anderson. 2010. Radiometer footprint model to estimate sunlit and shaded components for row crops. Agron. J. 102: 942–955.
Horton, R. 1989. Canopy shading effects on soil heat and water flow. Soil Sci. Soc. Am. J. 53: 669–679.
Ham, J. M., and G. J. Kluitenberg. 1993. Positional variation in the soil energy balance beneath a row-crop canopy. Agric. For. Meteorol. 63: 73–92.
Horton, R., O. Aguirre-Luna, and P. J. Wierenga. 1984. Soil temperature in a row crop with incomplete surface cover. Soil Sci. Soc. Am. J. 48: 1225–1232.
Mittelbach, H., and S.I. Seneviratne. 2012. A new perspective on the spatio-temporal variability of soil moisture: temporal dynamics versus time-invariant contributions. Hydrol. Earth Syst. Sci. 16: 2169–2179. http://dx.doi.org/10.5194/hess-16-2169- 2012.
Pieri, P. 2010. Modelling radiative balance in a row-crop canopy: Row–soil surface net radiation partition, Ecol. Modell. 221: 791–801.
Niether, W., S. Ulf, A. Laura, A. Noah, and M. Schneider. 2017. Spatial-temporal soil moisture dynamics under different cocoa production systems. Catena 158: 340–349.